


New in Financio: See How This Month Compares
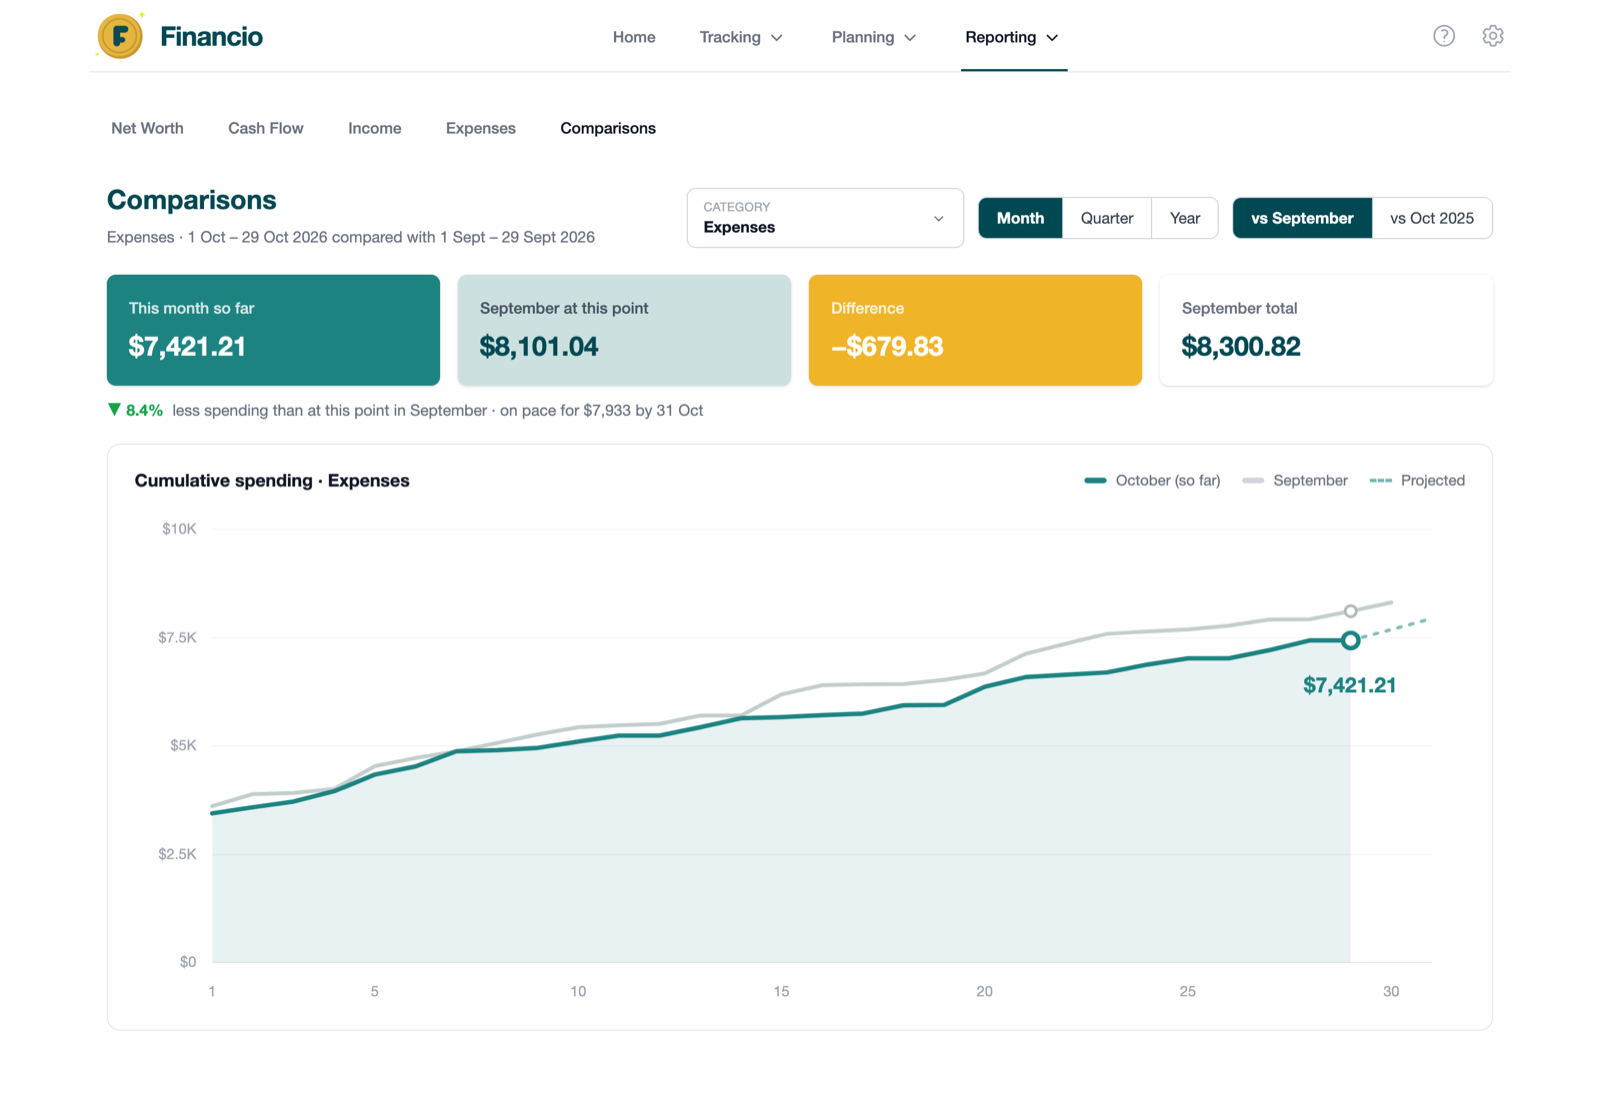
The Comparisons report charts your spending or income against last month, last quarter or the same time last year, day by day, so you know where you stand before the month is over
Beautiful charts, detailed breakdowns, and customisable reports. See where your money goes and how your wealth grows over time.

Powerful reports and visualisations that turn your data into actionable insights.
Get a complete overview of your finances at a glance. See income, expenses, savings rate, and key metrics all in one place.

Filter, export, and compare: everything you need to make sense of your finances.
Slice your data any way you want.
Filter reports by date range, account, category, or tags. Create the exact view you need to understand your spending patterns.

Take your reports anywhere.
Export reports as CSV for spreadsheets or PNG for sharing. Save your favourite report configurations to access them anytime.

This month against last, like for like.
Chart any category against the previous month, quarter, or year, or the same period last year, matched day for day. See exactly where you stand at this point and where the period is heading, or ask Insights a comparison question in plain English.

Slice your data any way you want.
Filter reports by date range, account, category, or tags. Create the exact view you need to understand your spending patterns.
Take your reports anywhere.
Export reports as CSV for spreadsheets or PNG for sharing. Save your favourite report configurations to access them anytime.
This month against last, like for like.
Chart any category against the previous month, quarter, or year, or the same period last year, matched day for day. See exactly where you stand at this point and where the period is heading, or ask Insights a comparison question in plain English.
Start understanding your finances in minutes. Import your transactions and see beautiful reports instantly.
View your first reportBuilt for real-world reporting
Every feature designed to help you understand your finances, from detailed breakdowns to beautiful visualisations you can share.
Tips and insights to help you manage your finances better.
The Comparisons report charts your spending or income against last month, last quarter or the same time last year, day by day, so you know where you stand before the month is over
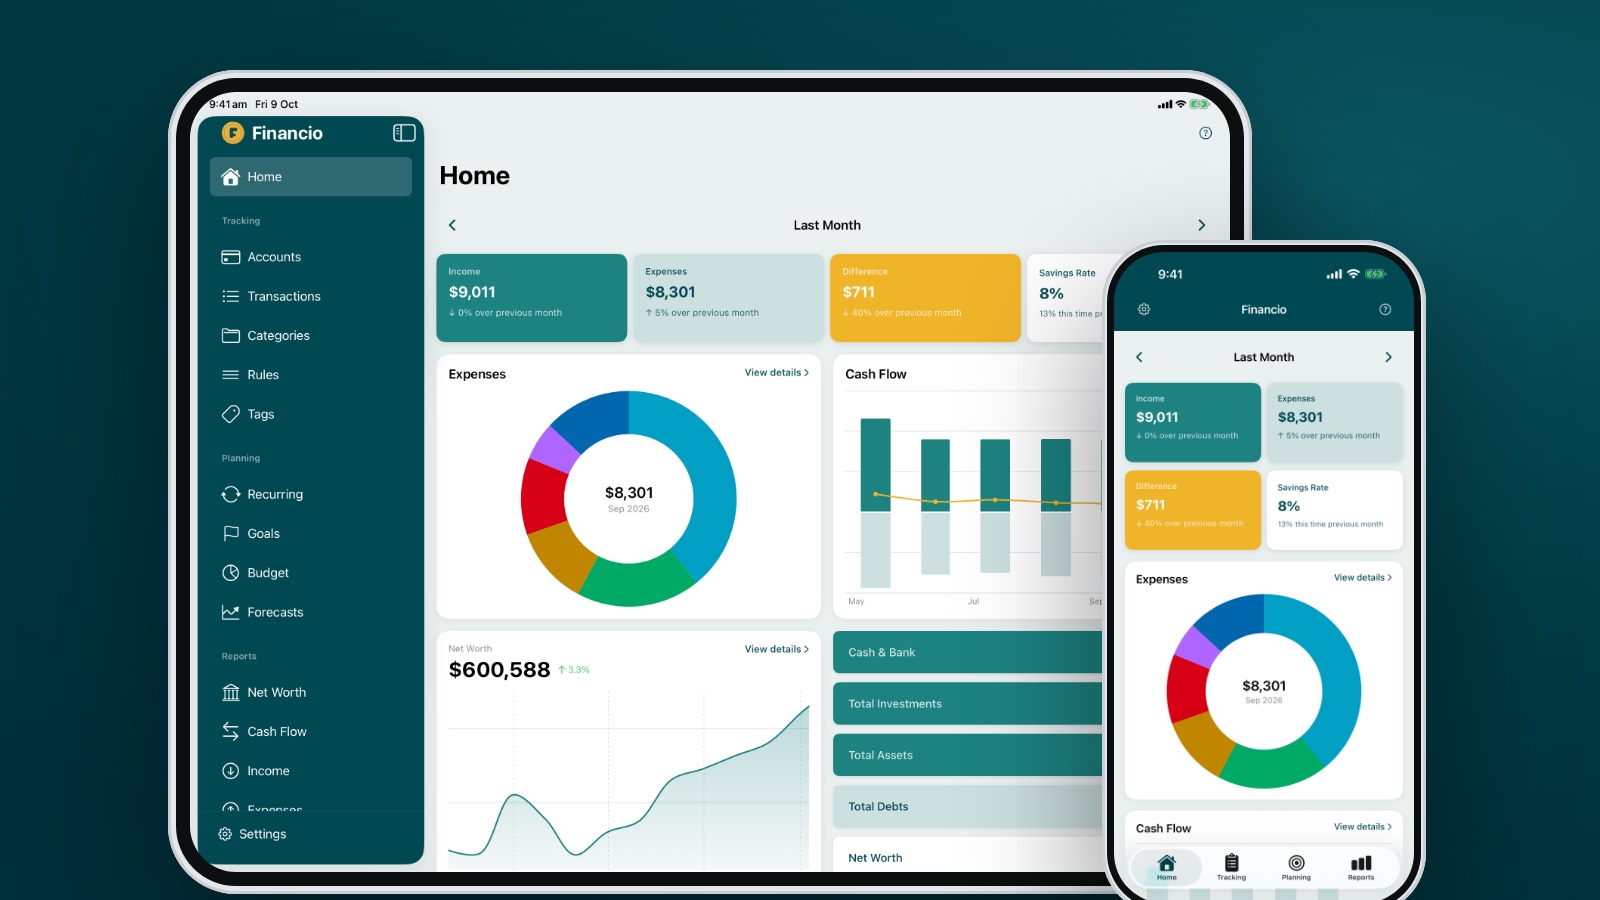
Version 2.0 brings a full iPad layout with a sidebar, a wider dashboard and room for your reports. Here is what changes and how to get it

How income investing works in Australia: what dividends are, how franking credits boost your return, what yield really means, and how much you need to live off your portfolio