Most money questions are really comparison questions. Am I spending more than last month? Is the power bill worse than last winter? Has my income grown this year? Until now, answering them in Financio meant flicking between months on the Expenses report and doing the maths in your head.
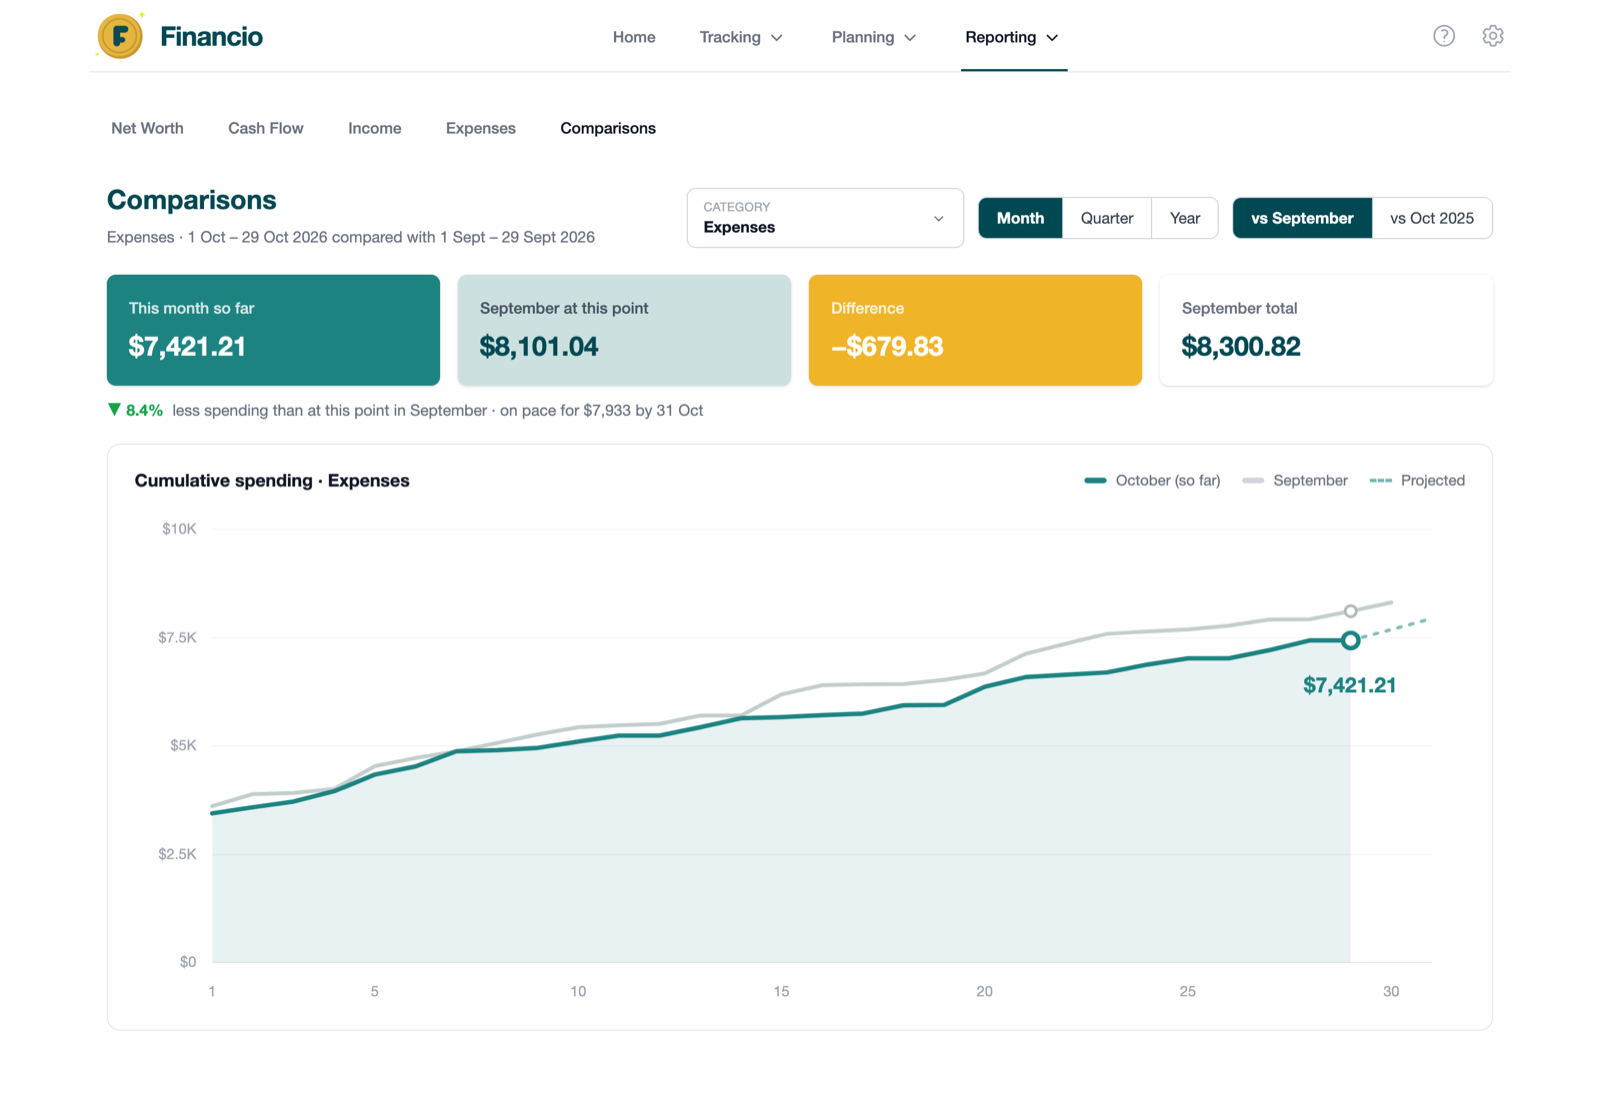
The new Comparisons report does that work for you. Pick a category and a period, and Financio draws this period and the one you're comparing against side by side, matched day for day, so you can see exactly where you stand right now, not just once the month is over.
Where you are, at this exact point
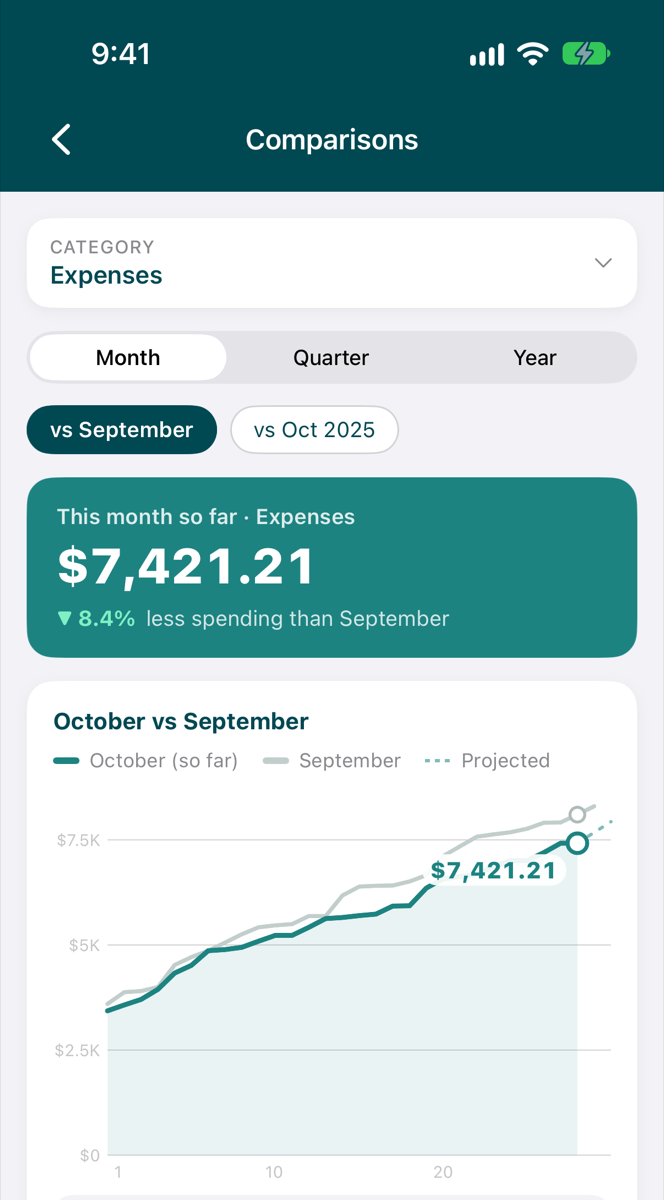
Monthly totals only tell you how a month ended. By then it's too late to do anything about it. The Comparisons report draws two cumulative lines that build up day by day:
- This period so far, in teal, drawn up to today
- The period you're comparing against, in grey, drawn in full, with a marker at the same point you're up to now
If it's the 20th, you're comparing your first 20 days with the first 20 days of last month. That's a fair fight: a month always looks expensive next to the previous one if you compare a half-finished month with a finished one.
Four cards sit above the chart: your total so far, the baseline at this point, the difference, and what the baseline period finished on. Underneath, a single line tells you how far ahead or behind you are and where you're on pace to finish.
Any category, at any level
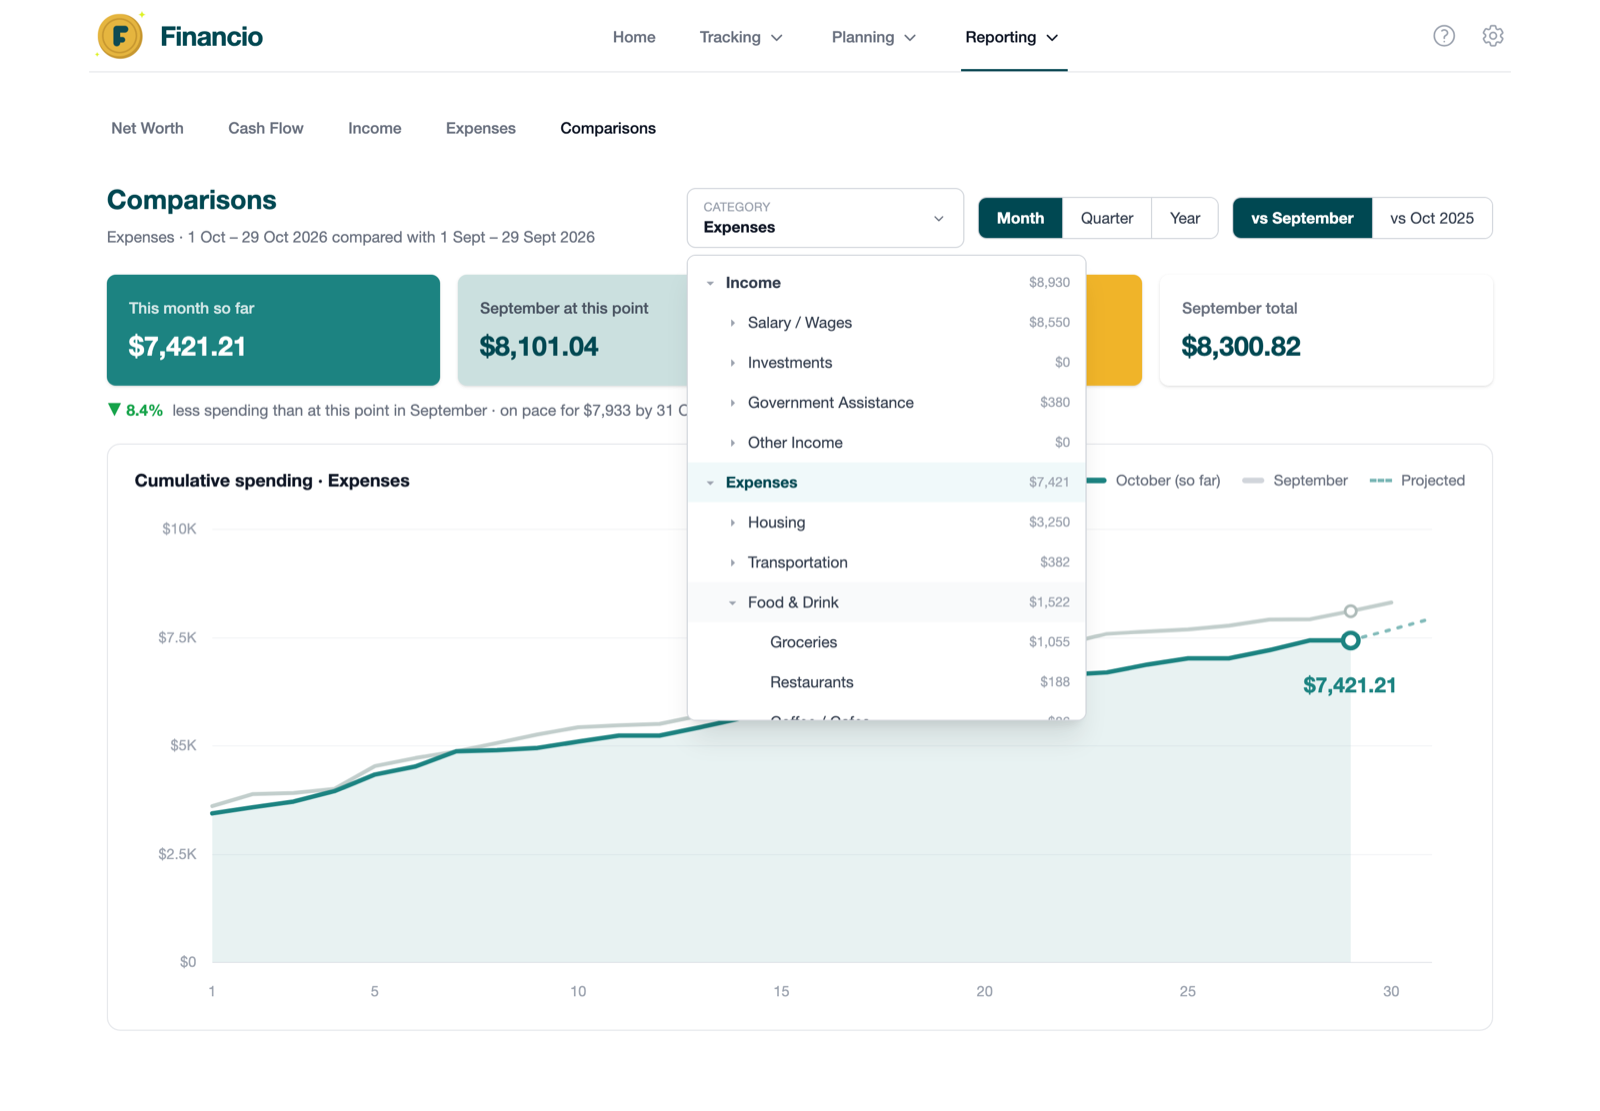
The category picker shows your whole category list with the amount for each one so far this period. Choose:
- Expenses or Income to compare everything
- A parent category such as Food & Drink, which rolls up everything beneath it
- A single category such as Groceries
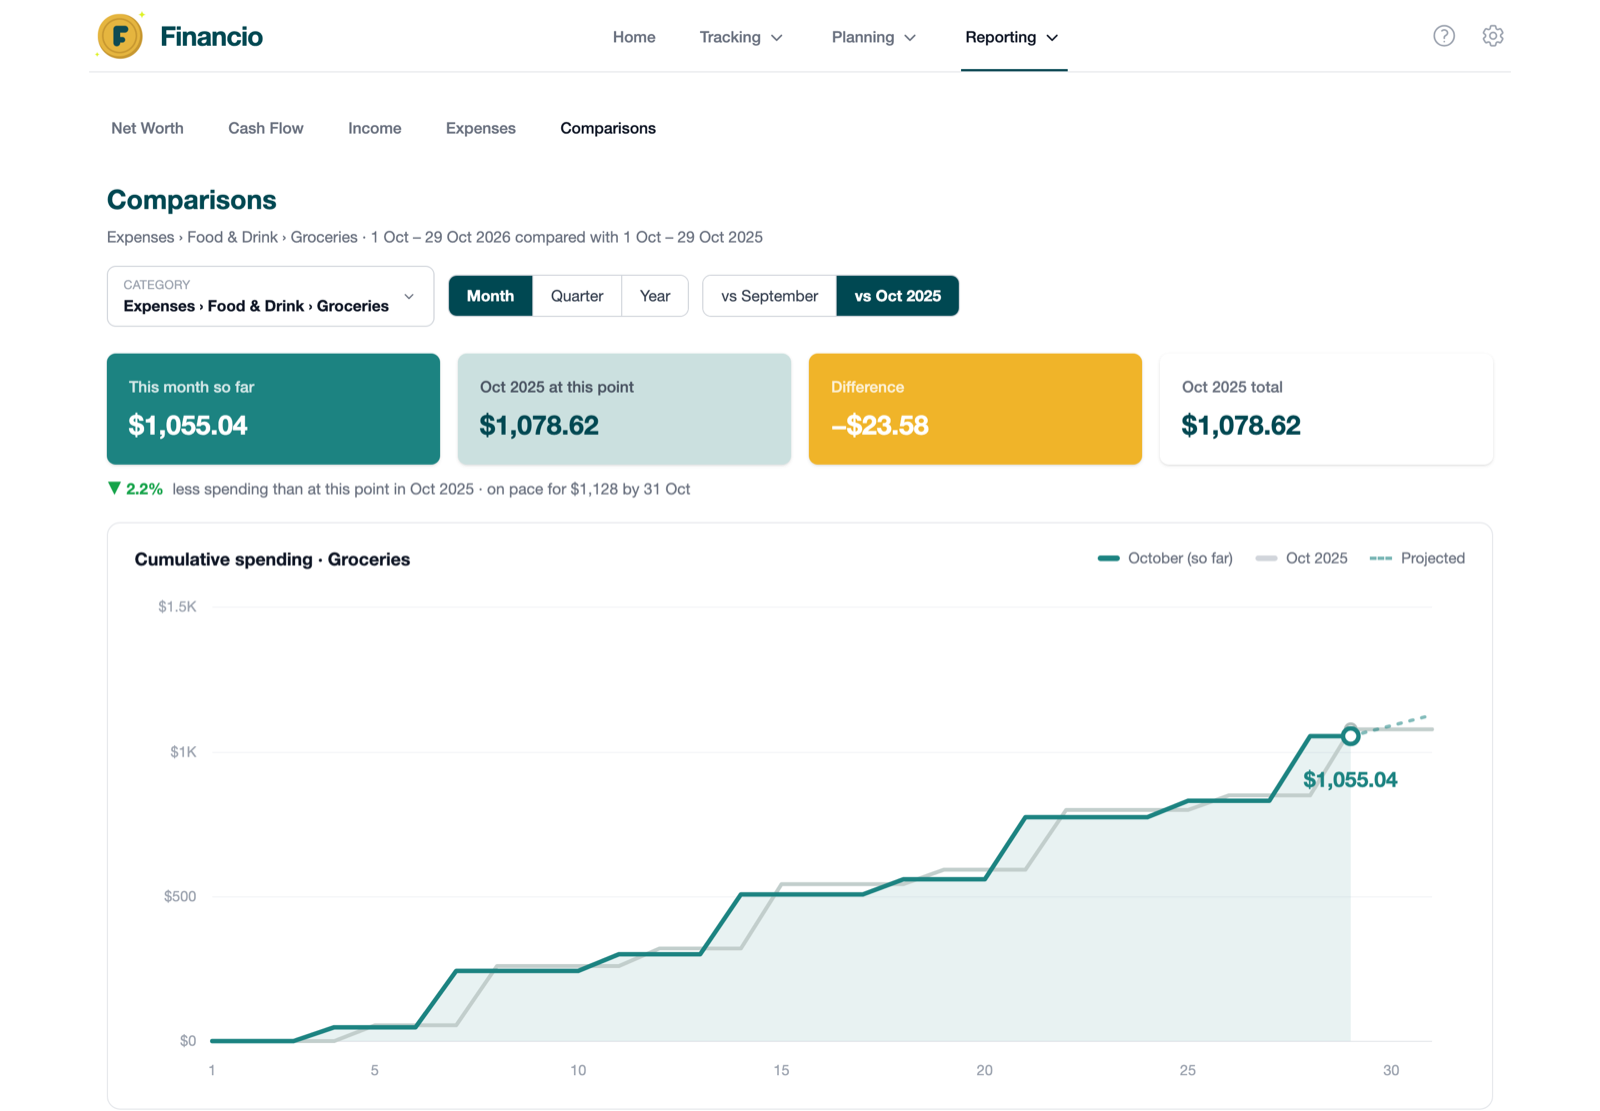
The colours understand what kind of category you're looking at. Spending less than last time shows in green; so does earning more.
Month, quarter or year, against the right baseline
Switch between Month, Quarter and Year, and choose what to compare against:
- The previous period: last month, last quarter or last year
- The same period last year: this October against last October
The second one matters for anything seasonal. Comparing your December spending with November will always look alarming, and electricity in July against June tells you little. Against the same month last year, you can tell whether you're genuinely spending more or it's just that time of year.
Where the month is heading
A dashed line continues the current period to its end at your current daily pace. It's a quick gut check: if the dashed line is heading well past where the grey line finished, you'll know with a week or two to spare.
Check any day
Hover over the chart on the web to see both lines and the difference for any day.
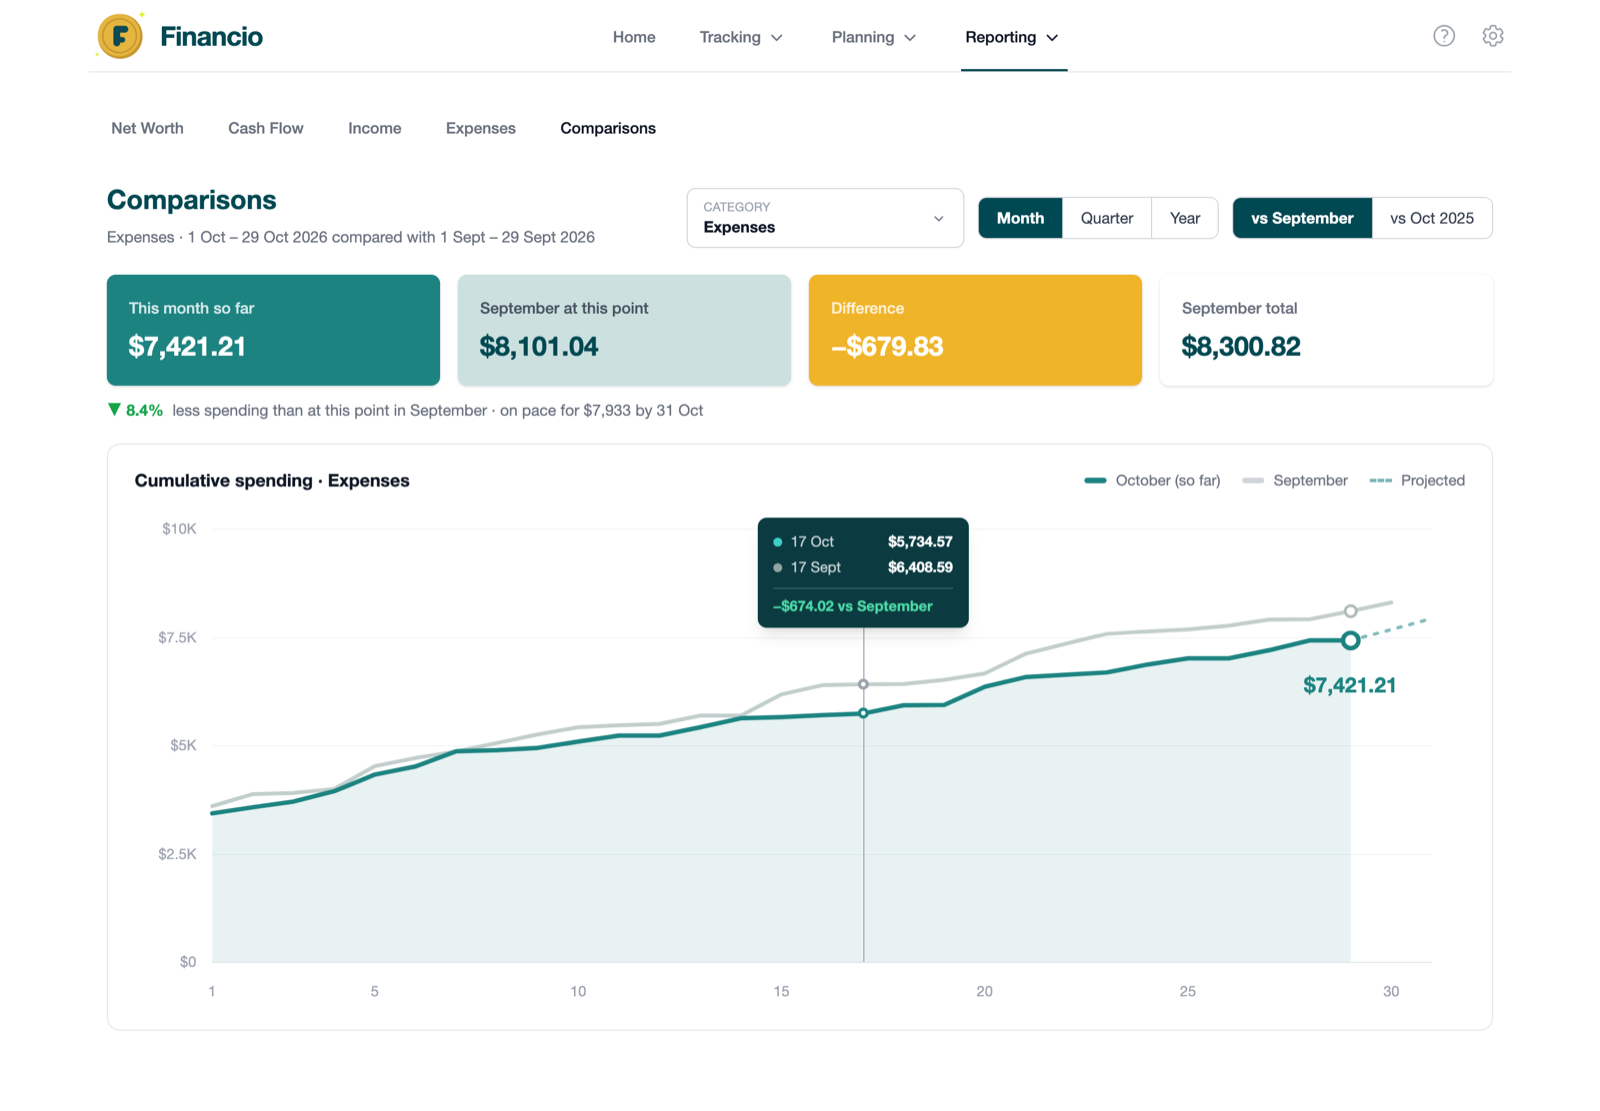
On iPhone and iPad, touch and drag across the chart and the same comparison appears in a panel underneath.
Three questions to try first
Am I overspending this month? Leave it on Expenses, Month, against the previous month. If teal is above grey, you're spending faster than last month. The dashed line shows where you'll finish if nothing changes.
Are the groceries creeping up? Pick Groceries and compare against the same month last year to see how much of the change is prices and how much is habit.
Is my income growing? Pick Income, switch to Year and watch this year build against last year.
How to get it
The Comparisons report is available now in Financio on the web under Reporting. On iPhone and iPad it arrives with the next app update, under the Reports tab. There's nothing to set up: it works from the transactions and categories you already have.
For a full walkthrough of the cards, the chart and every option, see the Comparisons report help article.
Tell us what you think
Comparisons came straight from your feedback, so keep it coming. If there's a comparison you'd like to make that the report can't do yet, email us at hello@financio.au.