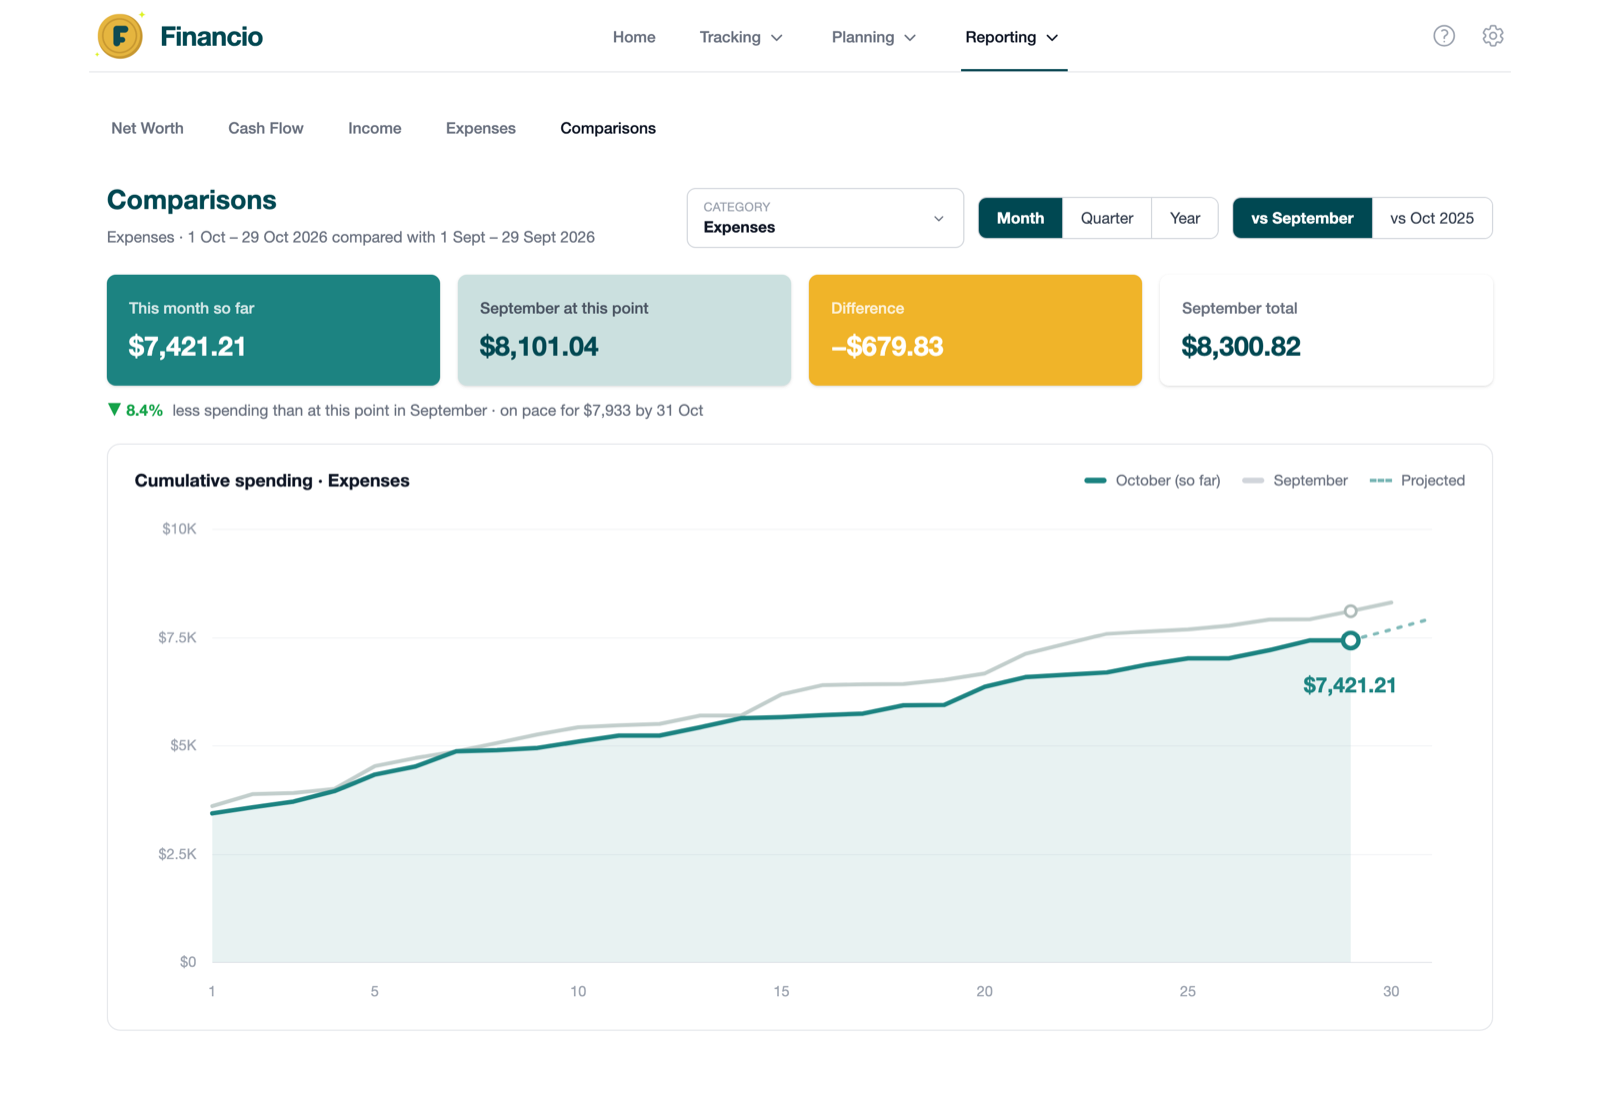
The Comparisons report shows how your spending or income for a category is tracking against an earlier period. Two cumulative lines build up day by day: one for the current period so far, and one for the period you're comparing against, so you can see whether you're ahead or behind at this exact point.
Accessing the Report
- Open Reporting in the main navigation.
- Select Comparisons.
On iPhone, tap the Reports tab, then Comparisons. On iPad, choose Comparisons in the sidebar.
Choosing a Category
Use the category picker to choose what to compare. You can pick at any level of your category hierarchy:
- Income or Expenses to compare everything in that section
- A parent category such as Living, which includes all of its subcategories
- A single subcategory such as Groceries
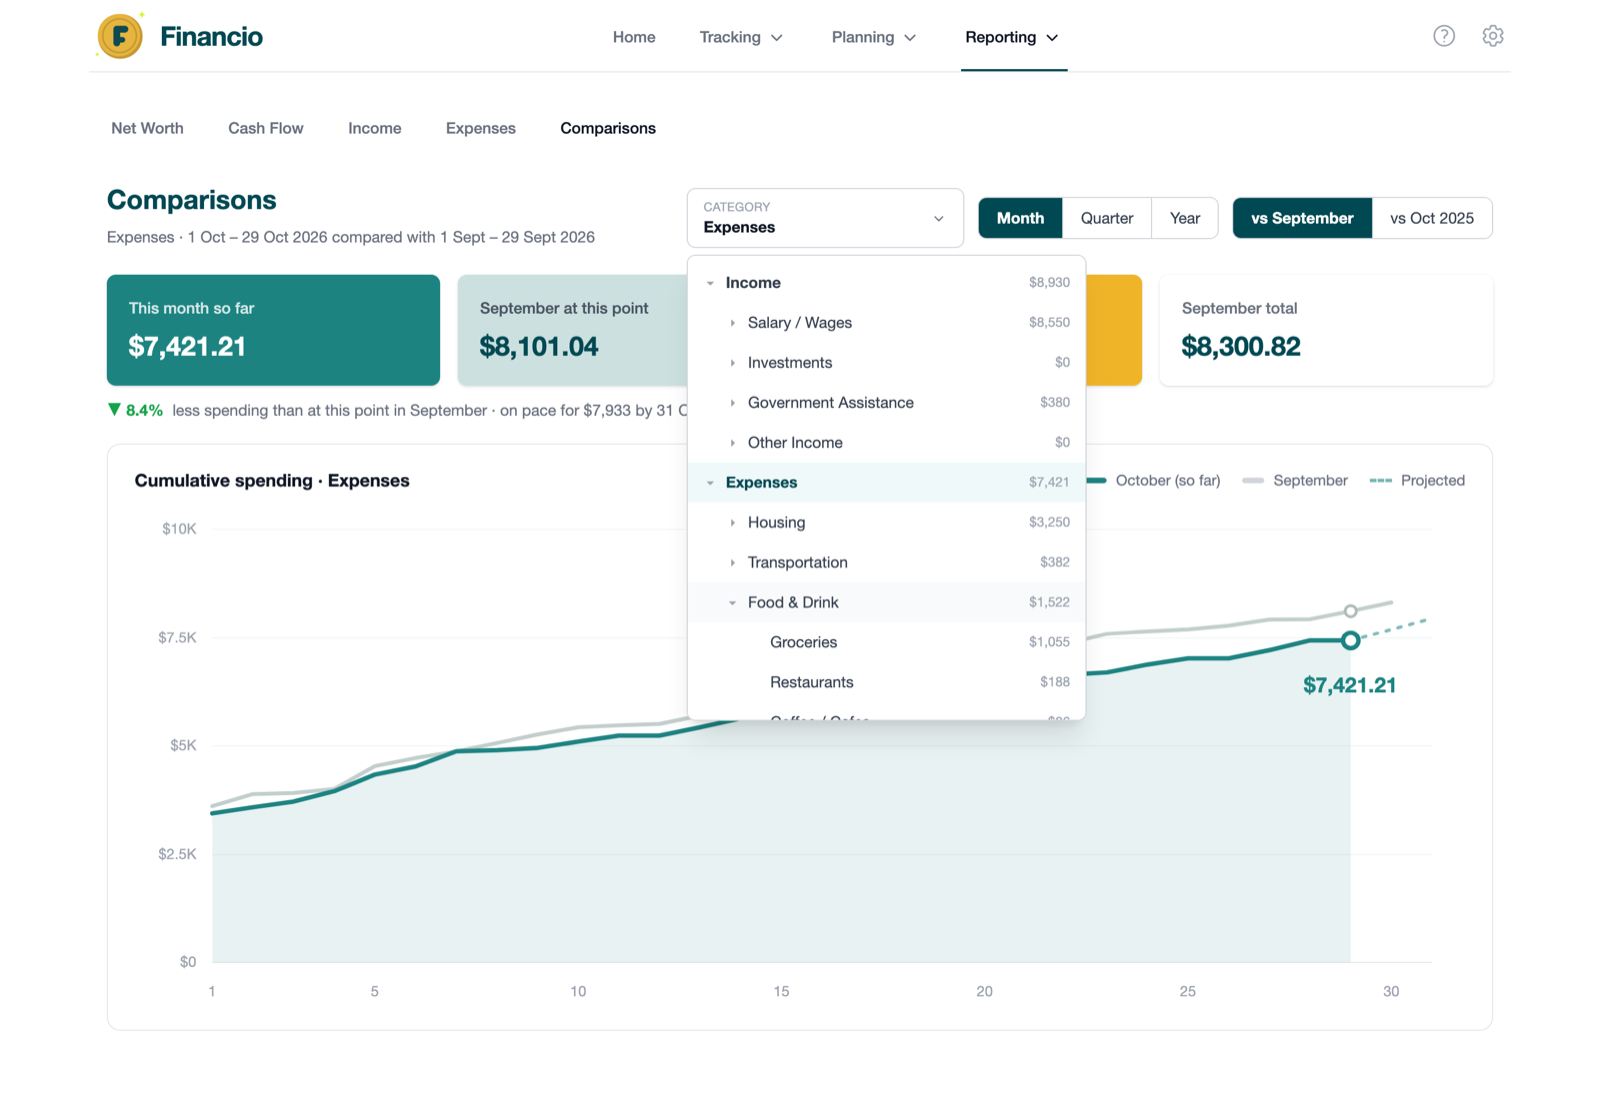
Each row in the picker shows the amount for the current period so far, so you can see where the money is before you drill in. Tap or click the arrow next to a category to expand its subcategories, and select the row itself to compare it. Your selection stays put when you change the period or baseline.
Time Periods
The period control switches the scope of the comparison:
| Period | Compares |
|---|---|
| Month | The current calendar month so far |
| Quarter | The current quarter so far |
| Year | The current calendar year so far |
Choosing a Baseline
The baseline control chooses what the current period is compared against:
- Previous period: last month, last quarter, or last year (shown as, for example, vs September)
- Same period last year: the same month or quarter a year ago (for example, vs Oct 2025), useful when your spending is seasonal
When comparing a year, the previous period and the same period last year are the same thing, so there's a single option.
Periods are matched day for day from the start of each period, so day 1 lines up with day 1. "At this point" always means the same number of days into the baseline period as you are into the current one.
Summary Cards
Four cards summarise the comparison at a glance:
- This month so far (or quarter, or year): your total for the current period to date
- At this point: what the baseline period's total was after the same number of days, for example September at this point
- Difference: the gap between the two, signed
- Total: what the baseline period finished on, for example September total
Below the cards, a percentage shows how far ahead or behind you are. The colour understands category type: for an expense category, spending less shows green; for an income category, earning more shows green.
Reading the Chart
- The teal line is the current period, drawn up to today and ending in a dot with the running total.
- The grey line is the full baseline period, with a hollow marker at the point matching today.
- The dashed line projects where the current period will finish if you keep the current daily pace.
Hover over the chart to compare any day: a tooltip shows the value on both lines for that day and the difference between them.
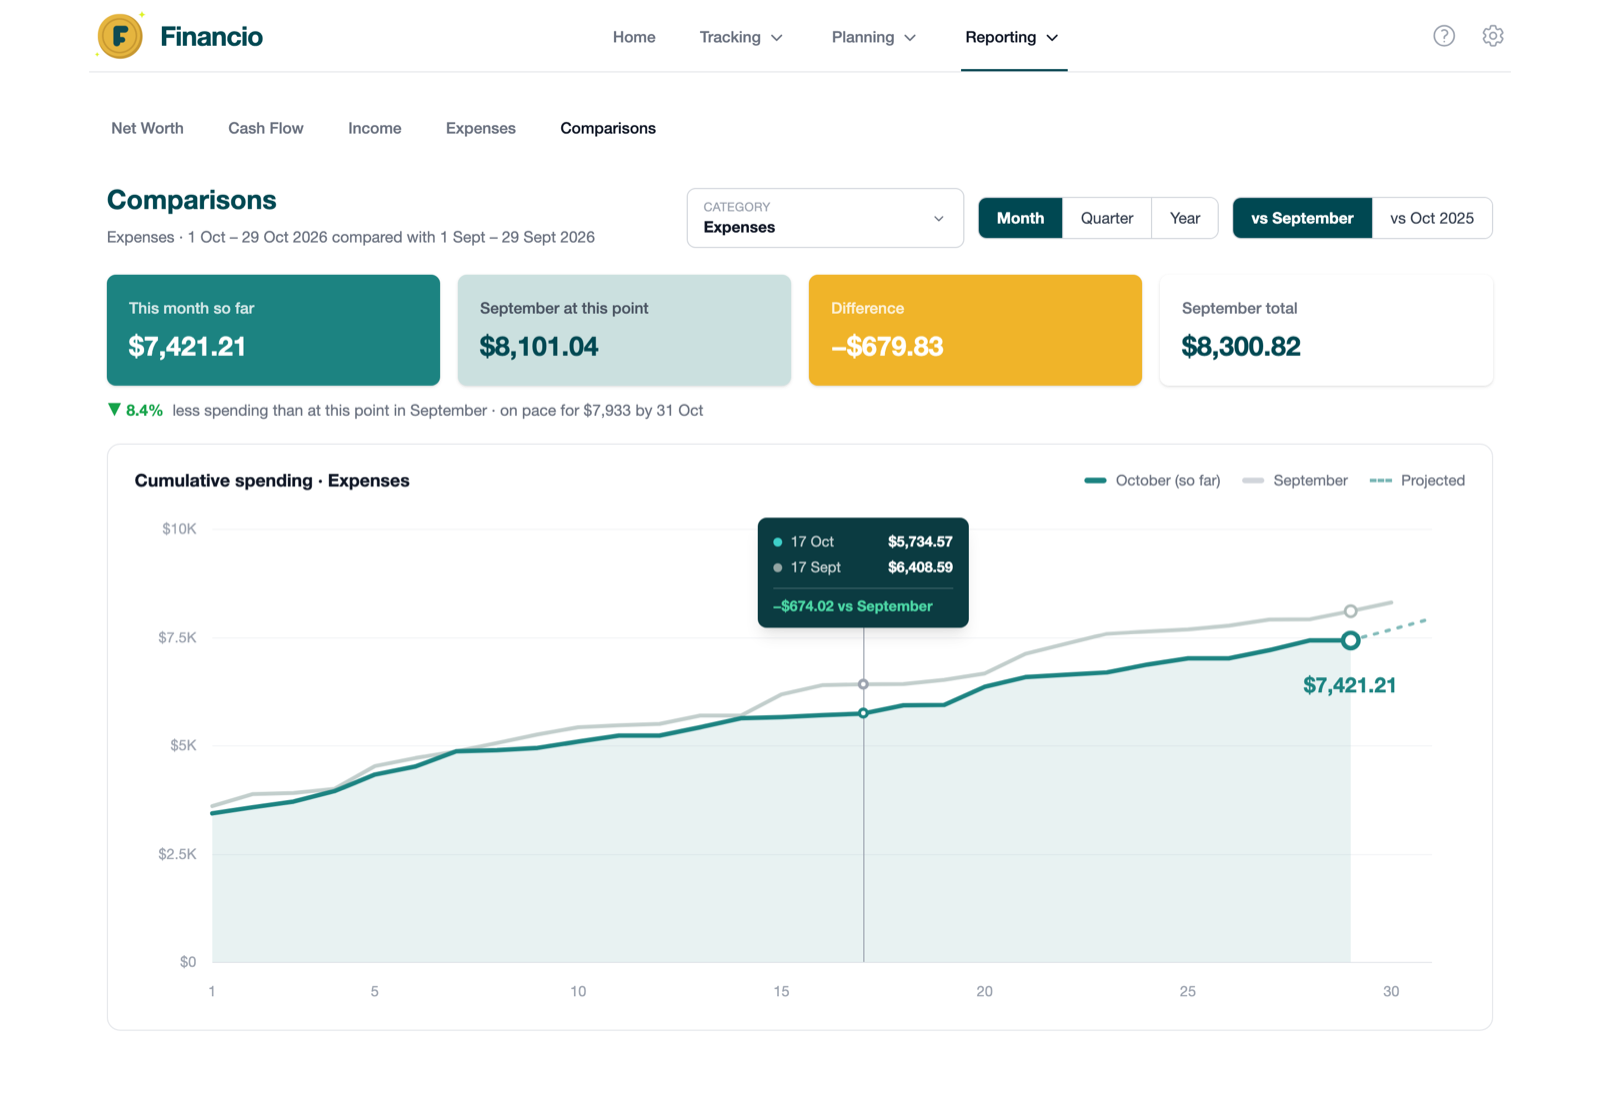
Touch and drag across the chart to compare any day: a panel below the chart shows the value on both lines for that day and the difference between them.
Common Use Cases
Am I overspending this month?
Leave the period on Month with the previous month as the baseline. If the teal line is running above the grey one, you're spending faster than last month, and the projection shows where you'll land if nothing changes.
Seasonal spending
Electricity in winter, holidays in December: compare against the same period last year to judge seasonal categories fairly instead of against an unrepresentative previous month.
Is my income growing?
Select Income (or a specific income category such as Wages) and compare the year against last year to see the trend building month by month.
For related reports, see: